Short post on how to profile a python app using KCachegrind.
Python's built in cProfile can be used to display stats for debugging issues with loops or slow sections of code. The text UI is is not the most pleasant.
The tool pyprof2calltree can convert the cprofile stats to those that can be opened and viewed in KCachegrind.
First run cProfile and save it to a file. Either use the command line:
python -m cProfile -o profile.stats -m <module>
Or import cProfile in your code, enable it, and call dump_stats.
Next take the file generated and convert it with pyprof2calltree.
pyprof2calltree -i profile.stats -k
The -k argument will start KCachegrind, or you can save the converted file with -o callgrind.out (or any name and just open it).
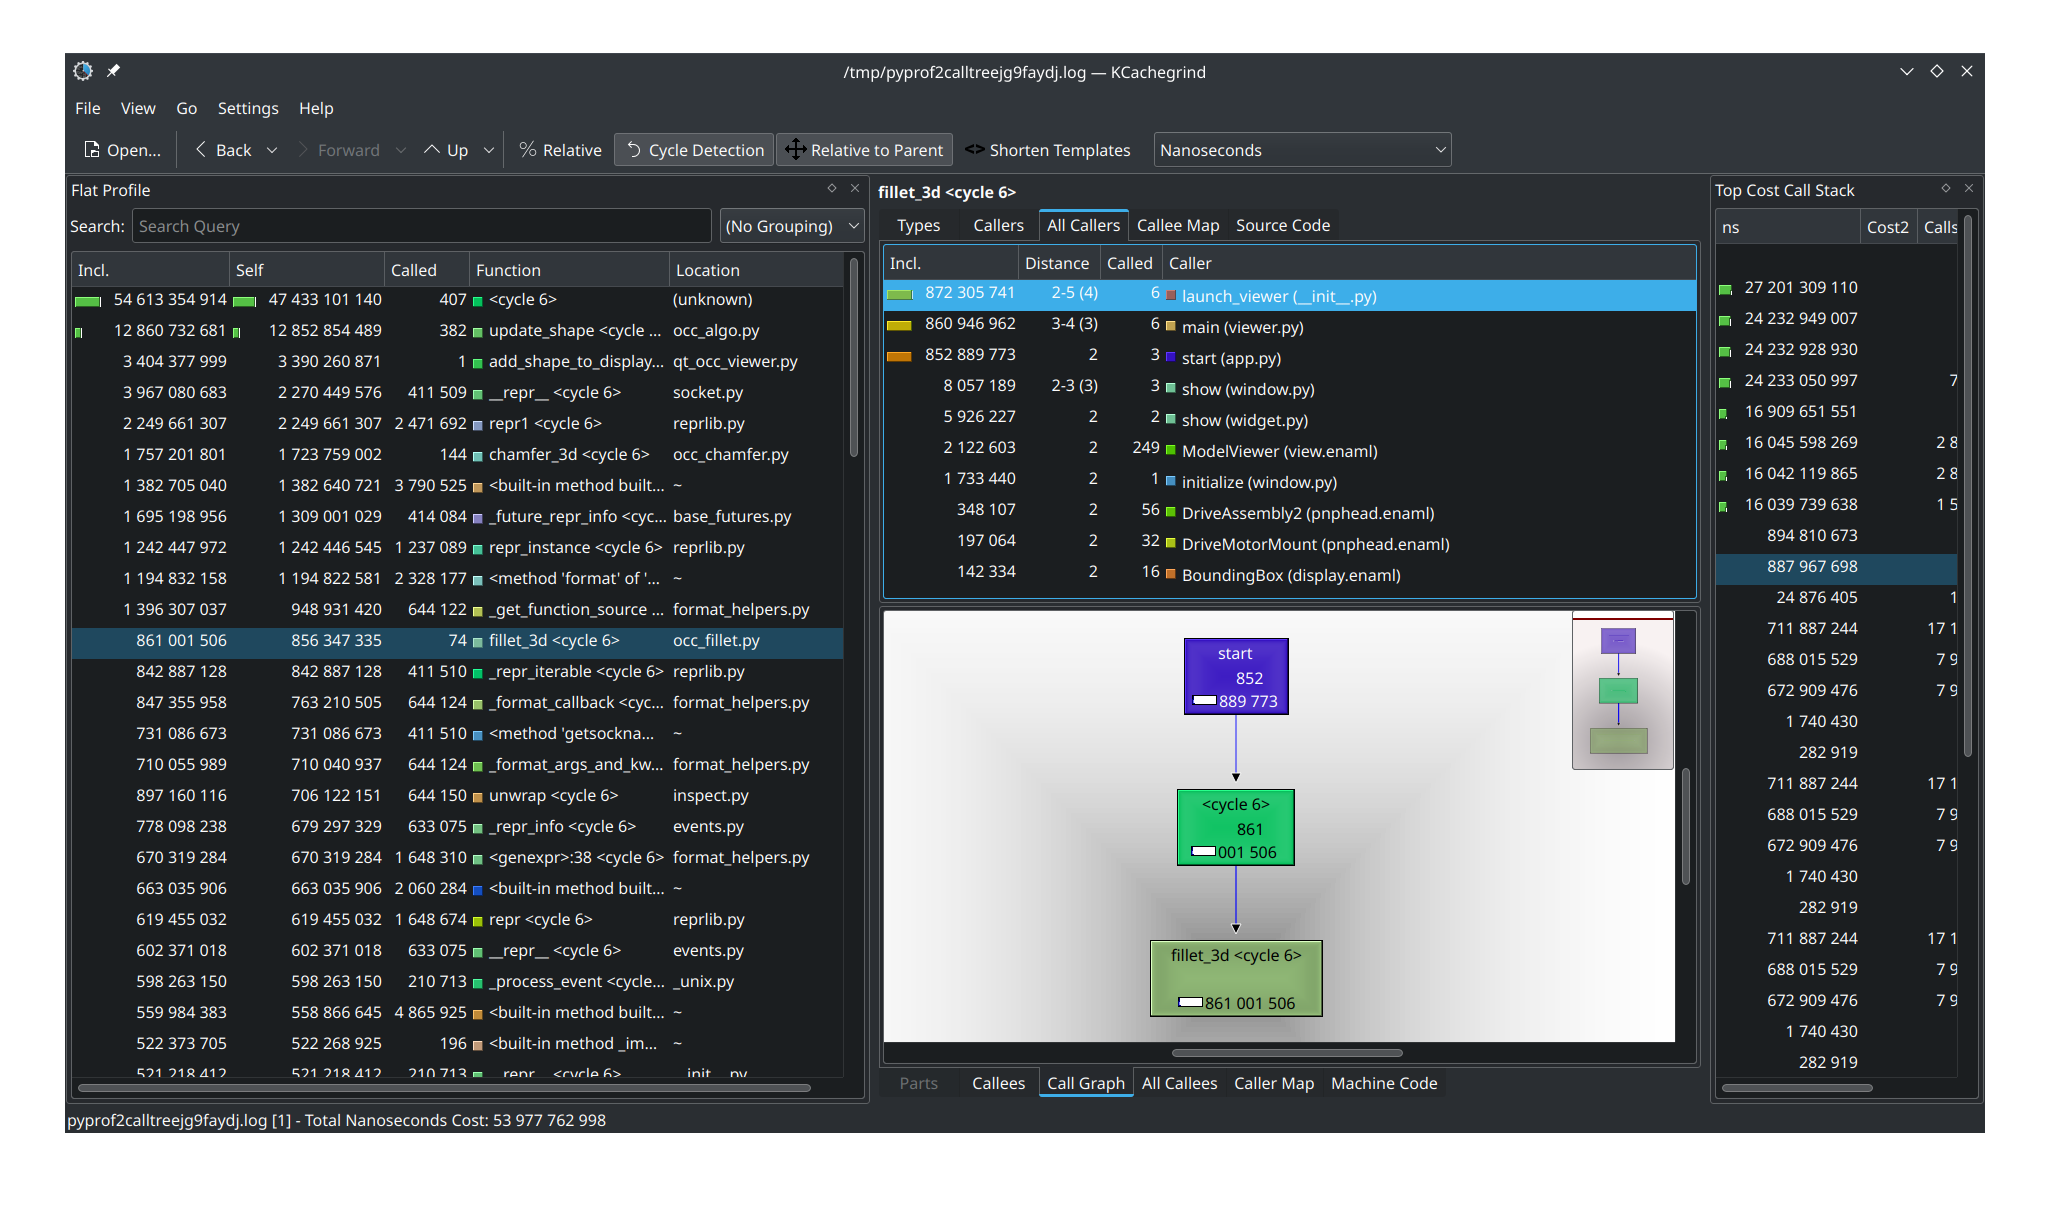
It'll open a nice gui with a call graph with different functions and the time taken, num calls, etc...
If you helped with any of the projects above, Thank you!!